New Department for Education data on school exclusions shows a sharp rise in exclusions in the academic year 2016/17, with a 15% increase in permanent exclusions compared with 2015/16. What else can we learn from the data when we dig behind the headline figures? Here are our top five findings…
1. The number of exclusions is high and growing
On average, 41 pupils are permanently excluded from English state schools every day. There was a total of 7,720 exclusions in the last academic year, up from 6,685 in 2015/16; a 15% increase.
The rise is not merely a function of the growing school population: the exclusion rate rose from 0.08% in 2015/16 to 0.10% in 2016/17.
Many point to system-wide factors influencing this rise in exclusions. Geoff Barton, General Secretary of the Association for School and College Leaders, suggested that the rise is caused by cuts to school funding and to funding for local authority services that support early intervention.
Julian Astle, Director of Education here at the RSA, has linked the rise in exclusions to the perverse incentives that the accountability regime creates. In the Ideal Schools Exhibition, he argues that there is no more egregious example of schools “gaming” the system than excluding students whose continued presence in a school threatens its league table standings.
2. Persistent disruptive behaviour is still the main reason for permanent exclusion
In 2016/17, 2,755 pupils were permanently excluded for persistent disruptive behaviour, which includes disobedience and persistent violation of school rules. This means that permanent exclusions under this category have increased by 19% over one academic year. This is the most common reason given for both permanent and temporary exclusions.
There is reason to think that there is a link to the introduction of progress measures. Directors of Children’s Services have reported that Progress 8 has contributed to a rise in illegal exclusions of pupils from schools as teachers/heads worry that poor behaviour of a minority of children could distract pupils, thus affecting overall progress scores.
However, media coverage has focused on the increase in exclusions for physical assaults on teachers. While deeply concerning, physical assault on an adult is less frequently given as a reason for both temporary and permanent exclusion than persistent disruption and physical assault on another pupil. There were 745 permanent exclusions under this category in 2016/17, a 2% increase on the previous academic year.
Media reporting is focused on the 14% increase in fixed-term exclusions (suspensions) for physical assault against an adult. Without in any way seeking to undermine the seriousness of physical assaults on school staff, who have a right to feel safe at work, it is worth noting that ‘physical assault’ is a broad category, ranging from ‘obstruction’ at one end of the spectrum to ‘wounding’ at the other. It may be that schools respond to ‘obstructions’ and similar infractions of behaviour policy with suspensions and that permanent exclusions are applied where harm comes to staff.
Use of the ambiguous ‘other’ category for exclusions has sky-rocketed. There is a comprehensive list of reasons for exclusions and the Department for Education emphasises that the ‘other’ category ‘should be used sparingly’. Yet, in the last academic year, there was a 21% increase in temporary exclusions, and a 20% rise in permanent exclusions, with ‘other’ given as the reason. Local authority analysis suggests this may be used in cases where schools feel that the reasons for exclusion fall under a number of the stated categories, rather than neatly fitting into one.
3. The highest rates of exclusions are from sponsored academies
The rate of permanent exclusions at secondary level from sponsored academies (0.32%) is nearly three times that of converter academies (0.11%) and double that of LA maintained schools (0.18%).
Some commentators have noted that given that sponsored academies were failing schools, exclusion of ‘difficult’ pupils may, unfortunately, be seen as a route to school improvement. A study from the University of Oxford suggests that off-rolling is a tactic used by underperforming academies.
4. Exclusions peak in Year 10
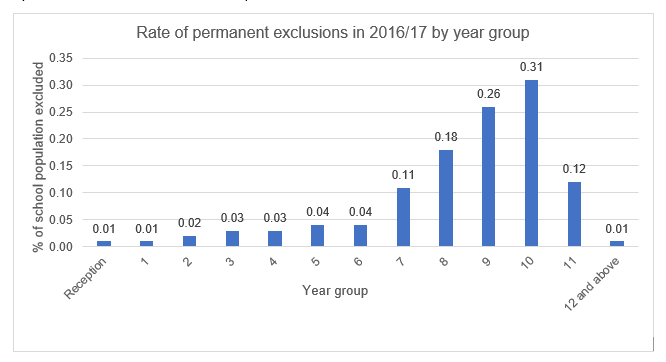
The Department for Education’s summary report (Permanent and Fixed Period Exclusions in England: 2016-17) reports that over half of permanent and fixed term exclusions occur in Year 9 or above. In fact, in 2016/17, they reached a peak (0.31% of the school population) in Year 10. This seems to support analyses like that of the Ideal Schools Exhibition that links exclusions to attempts to improve school results in national (GCSE) exams.
So, why isn’t the rate of exclusions also high in Year 11? The reality is that the GCSEs results of any student who is on the roll of a school in January of Year 11 count towards that school’s final data. Therefore, if exclusions were being used to secure more favourable exam results, we would expect to see high levels of exclusions in Term 1 of Year 11, and a sharp drop-off thereafter. The RSA is submitting an FOI to DfE and local authorities to ask for a term-by-term breakdown of exclusions to explore whether this is the case.

5. Disadvantaged students, those with special educational needs and certain ethnic minority groups are significantly more likely to be excluded
Pupils eligible for Free School Meals are around four times more likely to be permanently or temporarily excluded than their peers. This may raise questions about how well Pupil Premium funding is being used to meet the needs of these students while in mainstream education. Analysis from the Education Policy Institute last year showed that the attainment gap between Pupil Premium students and their peers was closing, but more slowly than expected: it only narrowed by 3 months from 2007-2016. Their latest analysis is due out this week.
Around half of all students excluded in 2016/17 had Special Educational Needs. Students with SEN are around six times more likely than their peers to be excluded. As RSA Fellow, and former PRU head teacher, John Watkin explained in a recent blog, the evidence from the school where he was a head shows that, “while pupils are nearly always referred to AP because of their behaviour, the clear majority of them are also significantly disadvantaged, or behind, in their learning”.
Pupils of Gypsy/Roma and traveller heritage were the group most likely to be excluded, and Black Caribbean students were around three times as likely to be excluded as their peers. As noted in a recent submission to the DfE’s call for evidence on school exclusions, we have to consider the intersectional nature of patterns of exclusion: certain ethnic minorities are more likely to be diagnosed with Special Educational Needs and to grow up in poverty.

Join the discussion
Comments
Please login to post a comment or reply
Don't have an account? Click here to register.
Hi Laura,
Such an important conversation to go back to. if you think about the current national focus - BrExit and the current state of school funding - highly strained. it's not surprising that perm exclusions are on the rise. And sadly not surprising the people who typically get excluded.
I'm not sure what the answer is... without thinking about it properly ... obviously great engagement and development strategies but without money i think its more about thinking what you can do differently.
However, i would say that kids typically behave in logical ways. if they are hungry, stressed, over stimulated, anxious, fearful or angry they will play up the trouble is our schools aren't designed really for kids with significant needs.
Daniel Snell
Arrival Education